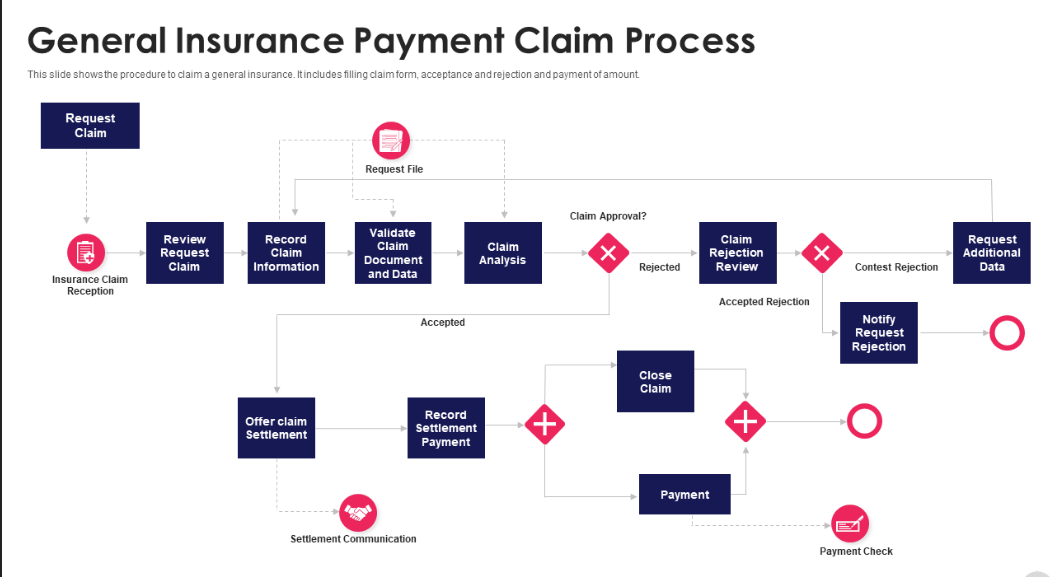
I. Understanding How Claims Are Paid — The Foundation of Every Health Plan
Level-Funded vs. Fully Insured: Claims Transparency
Every dollar spent on healthcare must flow through one of three pathways. Understanding who pays the claim determines how much transparency, control, and savings potential your organization has.
Carrier Pays the Claim Directly
Plan Types: Fully Insured, Level-Funded (only when stop-loss triggers)
In fully insured plans, the insurance carrier collects premiums and pays claims directly. Employers see limited or no claim-level data — you’re effectively renting coverage, not managing it.
In level-funded plans, the carrier only steps in when a specific or aggregate stop-loss is triggered (for example, a single high-cost claim ($15,000+) exceeds the specific attachment point). Until then, claims are paid from your claims fund.
Result:
- Fully insured plans: Minimal transparency
- Level-funded plans: Claims transparency
- Fully insured plans: Limited control over trend or cost containment
- Level-funded plans: real-time trends that do not violate HIPPA
- Fully insured plans: Exposure to renewal increases when there is no strategy to lower claims
- Level-funded plans: Exposure to renewal increases when the carrier’s stop-loss is hit (Exposure is reduced when the employer is able to stay within their claims fund)
How claims move through funding models: fully insured → level-funded → membership-blended hybrid.
Someone "Else" Pays the Claim (The Company Claims Fund)
Plan Type: Level-Funded or Self-Funded
Here, the employer contributes to a claims fund that pays employee medical expenses as they occur. The carrier (or TPA) administers claims, while stop-loss insurance protects the employer from exposure to the claim.
The goal: keep claims low enough to avoid triggering stop-loss. When you stay within the claims fund, the carrier remains profitable and your renewal increase is modest — often below 10% depending on market conditions and past experience.
Result:
- Full visibility into claims data
- Refunds possible when claims are low (surplus distributions)
- Strong incentive for claim reduction and early intervention
Carrier Is Blind to the Claim
Plan Type: Membership-Based or Hybrid Strategy
This strategy uses membership plans that pay directly for care outside the traditional insurance system — keeping claims “invisible” to the carrier.
Typical membership services:
- Telehealth and virtual primary care
- Mental health counseling
- Walk-in lab services
- Generic prescription programs
Blending this model with a level-funded plan can dramatically lower claims filed with the carrier, stabilizing premiums long-term. It’s difficult to implement with fully insured plans where premiums are already high and carriers often restrict carve-outs.
II. Why Claims Are the Core Cost Driver
Every health plan runs on a simple formula: premiums in, claims out. When claims rise, next year’s premiums follow suit.
The Premium–Claims Feedback Loop
Higher claims → higher risk → higher renewal rates.
Lower claims → refunds or credit in level-funded/self-funded models.
A single high-cost claimant — such as a cancer patient, neonatal ICU case, or a multi-year specialty drug regimen — can tilt a group’s renewal by double digits. Managing those outliers is essential.
Waste and Overuse Inflate Costs
Research indicates 20–25% of U.S. healthcare spending is waste (unnecessary tests, duplicate imaging, overtreatment). Reducing waste is one of the fastest ways to lower claim dollars without hurting care. [Source: JAMA, “Waste in the U.S. Health Care System,” 2020]
Cutting this waste doesn’t mean cutting care — it means buying smarter care.
III. How Claims Are Underwritten and Reserved
Claims Reserving and Trend Factors
Carriers set renewal prices using current claims, reserve needs (including IBNR — incurred but not reported), and projected medical trend. Typical trend assumptions vary by market but commonly sit in the mid-single digits to high single digits; plan-specific negotiation can move that number materially. Employers demonstrating multi-year claim control stand a better chance of negotiating more favorable trend assumptions. [Source: Mercer National Survey of Employer-Sponsored Health Plans, 2024]
Stop-Loss Underwriting and Its True Impact
Stop-loss insurance caps your plan’s exposure (specific and aggregate), but when stop-loss is used the underlying paid losses become visible to carriers and reinsurers — and that experience is priced back into future stop-loss and administrative rates. In short: stop-loss protects the employer from the immediate bill but does not prevent the underlying cost from affecting future premiums.
The strategic objective is therefore to:
- Keep high-cost episodes inside the claims fund where practical, or
- Make predictable or recurring costs invisible to the carrier (via membership or ICHRA strategies), or
- For unavoidable long-term costs, move those individuals to alternative arrangements (ICHRA + fully insured individual coverage) to protect the group.
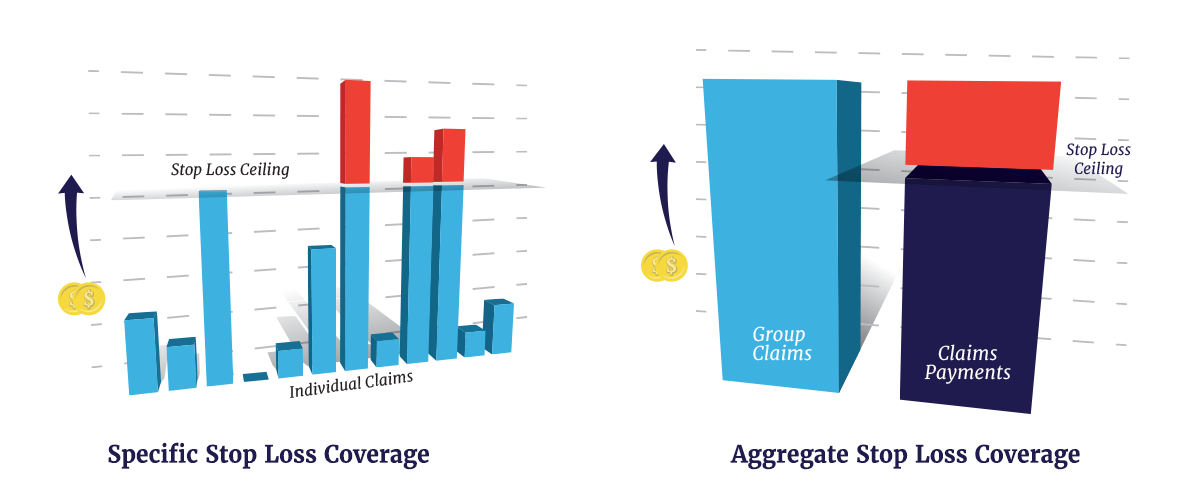
Specific and aggregate protection thresholds and how they relate to renewals.
IV. Underwriting Dynamics: Community vs. Direct Approaches
How carriers underwrite your group health plan—community-based or direct—shapes your premiums, transparency, and cost control. Understanding this dynamic is critical for choosing a plan that aligns with your cost-saving goals.
Community-Based Underwriting (Fully Insured Plans)
In fully insured plans, carriers use community-based underwriting, pooling all groups in a region or market to set premiums. Your group’s claims are averaged with others, meaning your costs reflect the broader “community” risk, not your specific employees. This reduces volatility for small groups but limits transparency and control. If the community experiences high claims—say, a regional uptick in chronic conditions—your premiums rise, even if your group’s claims are low. Studies show fully insured plans face 10–15% higher renewal increases than plans with direct underwriting when claims trends spike [Source: Kaiser Family Foundation, 2025 Employer Health Benefits Survey].
Direct Underwriting (Level-Funded Plans)
Level-funded plans use direct underwriting, where carriers assess your group’s specific risk based on a claims loss run report (a historical summary of your group’s claims) or, for new groups, demographic and health data. This ties premiums closely to your employees’ actual healthcare usage, offering greater transparency and control. If your group maintains low claims through strategies like ASCs or telehealth, renewals can stay below 8% [Source: SHRM, 2025 Health Plan Trends]. However, high-cost claimants (e.g., a single $100,000 case) can trigger stop-loss and impact renewals, making claims management critical (see Section II).
Choosing the Right Approach
Community-based underwriting offers stability for small groups but sacrifices control. Direct underwriting rewards proactive claims management, ideal for employers using the strategies in Section V. For example, a 50-life employer switching to level-funded with direct underwriting saved 12% on premiums by leveraging DPC and audits [Source: Association for Direct Primary Care, 2024].

Community vs. Direct Underwriting: Impact on premium control and transparency.
V. The Employer’s Playbook: Proven Strategies to Reduce Claims
Hybrid Membership Models: Combining DPC and Insurance
- Promote telehealth and virtual PCPs for non-emergent needs.
- Encourage urgent care rather than ER for after-hours issues.
- Provide cost-comparison tools to “shop” for procedures.
Evidence: Telehealth adoption reduces low-acuity ER utilization and can lower overall utilization for minor conditions. [Source: McKinsey, 2024]
Manage High-Cost Conditions Early
Approximately 5% of members drive ~50% of spend. Use de-identified claims data from your TPA to identify high-risk members and deploy nurse case management, condition-specific care pathways, and medication adherence programs.
Privacy note: Employers should receive de-identified or aggregated information unless members consent to sharing PHI. All data must comply with HIPAA and be de-identified before use.
Take Control of Pharmacy Spend
Specialty drugs often drive the largest single claim-dollar increases. Employers and TPAs have successfully used licensed international pharmacies, manufacturer assistance programs, and aggressive PBM strategies to reduce specialty spend — in documented cases turning a $10,000/month biologic into a $500/month cost through legal sourcing and co-pay strategies. Always validate regulatory compliance (FDA Section 804 protocols where applicable). [Source: Pharmacy price benchmarking and FDA guidance]
Real-world savings from licensed international specialty sourcing — ensure compliance with FDA rules.
Use Ambulatory Surgery Centers (ASCs)
Steer appropriate elective surgical procedures to ASCs, which commonly deliver equal outcomes at significantly lower facility costs (Health Affairs and HCCI analyses). Pre-authorization, guaranteed pricing, and employee education drive uptake.
[Source: Health Affairs, 2023]
Audit and Analyze Claims
Conduct regular third-party claims audits for billing errors, duplicate payments, and eligibility issues. Typical recoveries for mid-market employers can be 3–5% of paid claims in an audit cycle, depending on prior controls. [Source: SHRM benchmarking]

Detecting errors early — audit steps and outcomes.
Integrate Preventive and Behavioral Care
Behavioral health integration reduces medical escalation and improves adherence for chronic diseases. Peer-reviewed studies report measurable reductions in overall medical spend when mental health is embedded in primary care and case management. [Source: American Journal of Managed Care, 2023]
Blend Membership Models with Level Funding
Hybrid models (membership + level-funded plan) reduce billed claims by delivering routine and primary services outside the insurance claim stream. Evidence from direct primary care and hybrid pilots shows meaningful reductions in billed claims and improved member satisfaction. [Source: Association for Direct Primary Care, 2024]
Combining non-insurance membership plans with level-funded coverage to prevent routine claims from reaching the carrier.
VI. Advanced Claim Management and Analytics
How Predictive Analytics Reduce Employer Health Costs
Modern TPAs and vendors offer AI-driven predictive analytics to identify members trending toward costly events, detect fraud/waste/abuse, and prioritize interventions. Capabilities vary — ask vendors for predictive model performance, integration ability, and operational cadence. [Source: Deloitte Health Tech Insights, 2025]
VII. Turning Claims Control Into Premium Stability (Sourced)
Public carrier reporting and federal research show a practical pattern: visibility and intervention convert into monetary outcomes.
- Surplus refunds are common for level-funded groups. United Healthcare reporting (summarized in industry press) indicates that a meaningful portion (~37%) of level-funded groups receive surplus distributions in years where claims are below projections, with reported average surplus amounts (~$8,400) for groups that receive them. Carrier case examples also document mid-teen percentage first-year savings for some employers switching from fully insured to level-funded models. (See UnitedHealthcare / LeadersEdge reporting; Mercer context.)
- Transparency + intervention reduces surprise billing and improves employee experience. Evaluations of the No Surprises Act and transparency initiatives show fewer balance-billing incidents and improved consumer protections when price-transparency and direct-care options are available. Employers pairing these tools with active case management report fewer billing disputes and higher member satisfaction.
Practical summary: Use carrier benchmarks (e.g., UnitedHealthcare data), actuary context (Mercer), and federal evaluations (ASPE/NCBI) to set realistic expectations: visibility + intervention = higher likelihood of refunds, improved renewal stability, and fewer surprise bills for employees.

Employers pairing claims transparency and intervention achieve steadier renewals.
VIII. Tactics vs. Strategy: Choosing Smarter Cost Control
Many employers chase lower group health premiums, but not every approach yields lasting results. The difference between short-term tactics and long-term strategies determines whether you merely delay cost increases or control them sustainably.
Joining risk pools to spread costs across a larger group is a tactic. It can lower premiums temporarily by diluting the impact of high-cost claims. However, this doesn’t address the core driver: claims themselves. When claims spike—say, from a single high-cost case—premiums rise at renewal, erasing short-term gains (see Section II). Studies show risk pools reduce premiums by 5–10% initially, but renewals often climb 15–20% if claims aren’t managed [Source: Mercer National Survey of Employer-Sponsored Health Plans, 2024].
In contrast, plan features like outpatient surgery centers (ASCs), $0 cost telehealth plans, and lower-cost pharmacies form a strategy. These drive smarter healthcare choices, cutting claims directly. ASCs reduce procedure costs by 40–60% compared to hospitals [Source: Health Affairs, 2023]. $0 cost telehealth plans lower ER visits by 12–20% annually [Source: McKinsey & Company, 2024 Digital Health Adoption Report]. Sourcing specialty drugs from lower-cost pharmacies can save up to 95% on medications like those for rheumatoid arthritis (e.g., $500 vs. $10,000 monthly) [Source: American Journal of Managed Care, 2023]. By reducing claims 20–40% in some cases, these features keep renewal increases below 10% [Source: Association for Direct Primary Care, 2024].
Tactics like risk pools offer quick relief but falter when claims rise. Strategies that target claims ensure stable premiums and better outcomes for employees.
Tactics vs. Strategy: Short-term risk pooling vs. long-term claims reduction.

IX. Regulatory and Compliance Notes
- ACA: Understand MEC vs. MV (Minimum Value) requirements for employer responsibility.
- HIPAA: Use de-identified data or member-consented PHI for analytics and outreach.
- Drug Importation: International sourcing requires compliance with FDA rules and approved program pathways. [Source: FDA Section 804 guidance]
- Stop-Loss: Carefully review policy language for aggregation, carve-outs, and renewal-loading clauses.
- ICHRA: Use to isolate high-cost employees by shifting them to individually underwritten/market-rated coverage where appropriate; requires careful employee class definition.
X. The Takeaway: Manage the Cause, Not the Symptom
Premiums are driven by claims. Employers that take ownership — combining membership-based direct care, diligent pharmacy management, ASC steering, audits, and proactive analytic interventions — materially reduce the risk that catastrophic or chronic claims will push costs into the carrier’s stop-loss layer. That’s how renewals are stabilized and surprising bills are eliminated.
“You can’t stop premiums from being calculated — but you can stop claims from ballooning.”
Employers ready to apply these methods should begin with a claims audit and a funding model review—not a carrier quote. Contact Young Benefits for a free assessment.